Economic Affairs, Vol. 64, No. 4, pp. 769-781, December 2019
DOI: 10.30954/0424-2513.4.2019.12
©2019 EA. All rights reserved
Departmental Efficiency of Panjab University: An Analysis Using Dea and Tobit Model
Meenakshi Sharma* and Anjali Mehra
Department of Agriculture, Khalsa College, Amritsar, Punjab-143001, India
*Corresponding author: meenakshisharma212@yahoo.com (ORCID ID: 0000-0001-6465-4116)
Received: 06-07-2019
Revised: 04-10-2019
Accepted: 04-12-2019
ABSTRACT
The purpose of this paper is to assess the efficiency of teaching departments in Panjab University, Chandighar. The Data envelopment analysis and Tobit analysis is used to assess the teaching and research efficiency of a set of departments. Six models are proposed based on different parameters to cover various drivers of efficiency. We used both Charnes-Cooper-Rhodes (CCR) and Banker, Charnes and Cooper (BCC) output oriented model with three inputs and three outputs. Next, we present some important differences in efficiency of these departments. We also define benchmarks for inefficient departments and quantify the gaps to be fulfilled by them in order to become efficient. Further the robustness of DEA results was tested with help of Sensitivity analysis. The paper provides evidence that among teaching performance, the majority of teaching efficient departments were from the Social Sciences group and over the years, the teaching efficiency of Sciences departments improved and that of the Languages departments decreased. It is further observed that the majority of research efficient departments were from Sciences group, indicating that these departments are good performers for research activities like publications, research projects and paper presented.
Highlights
 The lack of research work is the main reason of inefficiency of teaching departments.
Keywords: Efficiency, DEA, Teaching and Research efficiency, University Departments
Universities play a dynamic role in nation building as they offer education and training, conduct research as well as extension work. In a developing country like India, higher education is provided both through government and private institutions. “At present there are 753 universities in the country with an enrollment of 28484746 students and employing 151541 academicians in university teaching departments, which include 47 Central universities, 123 Deemed universities, 345 State public universities, 235 State private universities and 3 Institutions of National Importance” (UGC Annual Report, 2016-17). The State universities are play a critical role in promoting higher education, but are facing challenges like shortage of funds, inadequate teaching staff, lack of quality research etc, which has resulted in the fact that none of the state universities of the country, find their place in top 100 best ranked universities in the world. With ever increasing enrollment of students into the public universities and limited funding, it is no longer an option for these institutes to operate at a higher degree of efficiency; it has rather become a necessity. Thus, it becomes imperative to evaluate the performance of these universities, so as to have an in depth analysis of their strength and weaknesses.
In order to measure the performance of non-profit organization like state universities, a performance measurement tool is required. Profitability as measure of performance cannot be used because the universities produce multiple outputs (e.g. graduates and publication) using multiple inputs (e.g. lecturer and facilities), which canot be assigned monetary value. Therefore the only option left is measurement of performance in terms of efficiency, through paramatric and non parametric techniques.
How to cite this article: Sharma, M. and Mehra, A. (2019). Departmental efficiency of Panjab University: an analysis using dea and tobit model. Economic Affairs, 64(4): 769-781.
The vast majority of the literature examines the efficiency across universities either on institutions or on departmental level. The most notable studies are Avkiran (2001), who examined the technical and scale efficiencies of thirty six Australian universities through DEA for the year 1995. The main findings from the study showed that the university sector was performing well on technical and scale efficiency, but there was room for improving performance on fee-paying enrollments. Most universities were operating at decreasing returns to scale, indicating potential to downsize their operation. Moreno & Tadepalli (2002) also evaluated the efficiency of forty two academic departments in the US Government University by applying the DEA approach. The results of the study revealed that only twenty two departments were found to be efficient and the department of Arts achieved the lowest efficiency score. The study suggested that the university administration should allocate more resources to inefficient departments to enhance their efficiency. Martine (2003) did the performance assessment of the fifty two departments in Zaragoza University in Spain using DEA during the year 1999. The study revealed that the majority of the departments had been assessed efficient. Kao and Hung (2008) also worked out the relative efficiency of academic departments of University and suggested using DEA as a planning tool. Another set of studies were done by Tyagi et al. (2009) and Halkos et al. (2010), who worked out the departmental efficiency with the help of DEA analysis. They illustrated how the recent development in efficiency analysis and statistical inferences can be applied when evaluating institutional performance issues. The results revealed that the existence of misallocation of resources or inefficient application of department’s policy development. Kuah (2011) evaluated the efficiency of thirty universities through the DEA. The results of the study revealed that out of thirty universities, three universities were efficient in their teaching activities, and eleven universities were considered efficient in their research activities, while only one university was considered efficient in all of the three criteria. Agha (2011) and Aziz et al. (2013), carried out the comparative departmental efficiency analysis by using DEA technique to investigate the performance of departments with different dimensions, four models with different input-output combination were defined. Sensitivity analysis performed suggested that different combinations of input-output yielded different efficiency scores.
Revewining the empirical work it was observed that though the performance of universities has been measured in term of technical efficiency in many empirical studies internationally, but sparse work has been done at national level, with practically negligible work at state university level. The present study is an attempt in this direction. Specifically the objectives of the study are:
♦To analyse the overall technical efficiency of the various teaching departments of Panjab University, Chandigarh.
♦To decompose the OTE of the departments into PTE and SE, to find the main source of inefficiency of departments.
♦To test the robustness of the results using senstivity analysis.
♦To workout the research efficiency and teaching efficiency of university departments.
♦To find the factor effecting efficiency of the departments.
For fulfilling these objectives, the study has been divided into six sections including the present one. i.e the Introduction. Section II briefly outlies the material and methods in the study. Section III focuses on the profile of Panjab University along with the measurement of OTE of the University departments. Section IV attempts to check the robustness of the efficiency scores with the use of Sensitivity analysis. Section V tries to find the factors influencing efficiency scores through Tobit Regression analysis, while Section VI summaries the findings and presents the policy implementation.
SECTION II
MATERIALS AND METHODS
Data Envelopment Analysis is developed by Charnes, Cooper, and Rhodes (1978) and extended by Banker, Charnes and Cooper (1984). It is used to evaluate the performance of a set of peer entities called Decision Making Units (DMUs), which coverts multiple inputs into outputs. The efficiency is estimated relative to the best performing DMU. The best performing DMU is assigned an efficiency score Unity and performance of other DMUs vary between 0 and 1.
The most basic DEA model is the CCR model. It was developed to evaluate relative efficiency of homogeneous DMUs with multiple inputs and multiple outputs. Suppose there are n DMUs to be evaluated where each DMU has m inputs and outputs. The relative efficiency of a DMU0 (where o ranges over 1, 2,.…, n) is evaluated by solving the following fractional programming problem:
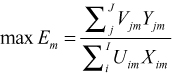
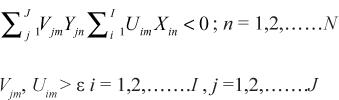
Let there be n DMUs whose efficiencies have to be compared. Let us take one DMU, say mth DMU and maximize its efficiency subject to the constraint that efficiency of other DMUs cannot exceed 1 with same weights as for DMUm,
Subject to,
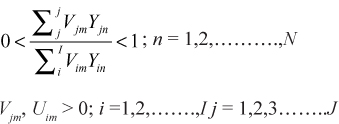
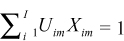
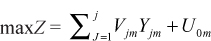
Where E m is efficiency of mth DMU, ϒjm> is the jthoutput of mth DMU, Vjm is the weight of that output, Xim is ith input of mth DMU, Uim is the weight of that input. The above mathematical program, when solved will give the values of weights u and v. If efficiency is unity, then DMU is said to be efficient and will lie on frontier. Otherwise, the DMU is said to be relatively inefficient. The general form of CCR (Charnes, Cooper Rhodes) DEA model can be written as,
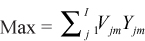
Subject to,
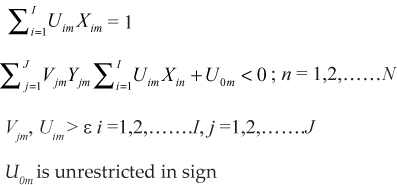
The general form of BCC model can be written as,
subject to,
DEA also identifies the reference sets called peer group. A peer group contains two or more efficient DMUs for an inefficient DMU. Thus, an efficient DMU may be a peer for one or more inefficient DMUs. A DMU which appears frequently as a peer for more inefficient DMUs or has a high peer count is considered as an example of good performance.
Sensitivity analysis
“Sensitivity analysis is a way to test the robustness of DEA results. The analysis is conducting by omitting an input or output and then studying the results” (Ramanathan, 2003). We use this method as second stage testing method for our study.
Tobit regression model
“Tobit regression model is a statistical non-linear model proposed by James Tobit to describe the relation between a non-negative dependent variable ϒi and an independent variable Xi. The word Tobit is taken from the name Tobin and “it” is added to it” (Joreskog, 2002). This model has been extensively used in estimating determinant variables on efficiency. It is mainly used with DEA model as the second stage of analyzing efficiency in various fields including education.
Research Design
According to Dyson et al. (2001) the number of DMUs >=2*s*m. In the present study there are three inputs and three outputs, while the decision making units are forty teaching departments, so DMUs>=2*3*3=18. Hence condition is satisfied.
Variable Selection
As public institutions, a University uses multiple inputs to produce multiple outputs. For the present study following three inputs and three outputs were used to asses the performance of departments through technical efficiency.
Input Variables
1.Teaching staff- the faculty members has been taken as input variables by Avkiran (2001), Abott and Doucoullagos (2003), Tyagi et al. (2009) and includes faculty members of the university. As these are divided into different ranks so in order to construct a proper aggregate measure, weights were assigned to different ranks in such a manner that the distance between two ranks was one third (1/3) = .33. Thus, a Professor was given weight as 1, Reader or Associate Professor with .666 and Assistant Professor as .333.
2.Non-teaching staff- work for teaching staff and is also known as auxiliary staff and include teaching aides, technical and administrative staff. The previous studies that used the same indicator were of Avkiran (2001) and Tyagi et al. (2009).
3.Departmental Operating Cost: is the cost or amount of fund disposed of by each department for its developmental activities or maintainance. It is recurring cost of the department and this variable was also used by Abott and Doucoullagos (2003), Tyagi et al. (2009) in their research.
Output Variables
As the main functions of a university are teaching and research. Therefore the main output variables taken were:
1.Enrollment- it appeared as output in the studies of Avkiran (2001), Abbott and Doucouliagos (2003), Tyagi (2009) and Halkos and Tzeremes (2010). It represents the quality and quantity of any department. Weights were again assigned to different student ranks. The doctoral students are assigned with 1, Postgraduate with .666 and graduate with .333.
2.Research - Research is an essential part of university and is the most controversial output in literature, many studies like, Avkiran (2001), Abbott and Doucouliagos (2003) Tyagi (2009) and Halkos and Tzeremes (2010). While measuring the research performance of departments, several parameters had to be considered. Each parameter has its own shortcomings, so weights were assigned to each parameter of research in following manner
Research = Number of projects by Department + 0.8 (Number of publication by each Department) + 0.6 (Number of book published by each department) + 0.4 (Number of paper presented in Conferences and Seminar by each department) + 0.2 (Number of Conference and Seminars attended by faculty of each Department).
3.Progress- department’s student is taken as proxy and is measured in term of number of PhD’s awarded by each department during the study period.
Choice of Orientation
There are two choices of orientation in DEA are input oriented and output oriented. The aim of input orientation is to minimize the inputs at given output level and the aim of the output orientation is to maximize the output at given level of inputs input. The present study employs output orientation because inputs variables taken are inflexible for a particular time period. At the same time output variable like research and progress cannot be decided in advance, while only one output variable “enrollment” can be fixed, so output-oriented model was considered to be appropriate for our analysis.
Return to Scale
“There are two types of scales that are Constant Return to Scale (CRS) and Variable Return to Scale (VRS), which can be used to measure overall technical efficiency. CRS assumes that an increment in inputs results in proportion increment in output, while VRS assumes that an increment in inputs results in a disproportionate increment in outputs” (Cooper & Seiford, 2001). Both CRS and VRS are employed in this study and results were compared.
Data and Sample
The present study is based on the information collected about teaching departments of Panjab University, Chandigarh. Those departments were included which run graduate, postgraduate and doctoral programmes in the main campus, while the departments imparting diploma and certificate courses were left out. The sources for the data are Budget Estimates and Annual Reports (Various Issues) for Panjab University, Chandigarh.
SECTION III
RESULTS AND DISCUSSION
Profile of Panjab University
“Punjab, a north western state of India, is ranked thirteenth among the states as far numbers of universities (26) are concerned, and with 1080 colleges occupies fourteenth position in college category. For students enrollment the state ranks thirteenth with 680816 lakhs enrollment” (UGC Annual Report,2016-17 (a)). Punjab University, the oldest university in the State is ranked twelfth with a score of 67.32 and it was established in 1882 as University of Punjab at Lahore (now in Pakistan), post independence in 1960, it was shifted to its present campus at Chandigarh, Punjab. It is spread over an area of 550 acres (2.2 km2) in Sectors 14 and 25 of the city of Chandigarh and has 78 teaching and research departments, 15 Centers/Chairs for teaching and research. The university has 188 affiliated colleges spread over Punjab and also one rural Regional Centre at Kauni and 3 Regional Centres at Muktsar, Ludhiana and Hoshiarpur. It has 4 constituent colleges located at Sikhwala (Sri Muktsar Sahib), Balachaur (SBS Nagar), Nihalsingh Wala (Moga) and Guru Harsahai (Ferozepur). It has been imparting education in Arts, Letters, Science and the Learned Professions with a focus on furthering advancement of learning and the prosecution of original research. (www.puchd.ac.in).
Table 1 reveals a brief picture of the Panjab University, Chandigarh at its main campus at six different points of time. The number of departments, faculty both teaching and research, enrollment of students, PhD awarded and number of papers published were considered as academic indicators of the University. The results of the study revealed that the total number of teaching and research departments has also increased from 43 in 1990, to 78 in 2014 at a compound growth rate of 2.51 percent annually, while the total enrollment has nearly doubled to 9862 in 2014 from 4807 in the 1990, showing higher growth of 3.04 percent annually. This was due to increase in female student enrollment (3.58 percent annually) as compared to enrollment of male students (2.43 percent annually). The growth of teaching faculty does not commensurate with enhancement in enrollment, as there is a decline of teaching faculty from 583 in 1990 to 513 in 2014, having a negative growth of -0.53 percent annually. The faculty posts are lying vacant in the University, which has resulted in an adverse student teacher ratio. Due to financial constraints, the University is now employing teachers on contract-basis or lecture-basis, which adversely affects the quality of education. The compound annual growth rate for non-teaching staff (1.36 percent annually) was found to be satisfactory. The number of students awarded Ph.D also increased from 89 in 1990 to 169 in 2014, while the other aspect of research i.e number of pulications increased at 3.50 percent, indicating the increase in research in the university.
Table 1: Profile of Panjab University, Chandigarh (Main Campus)
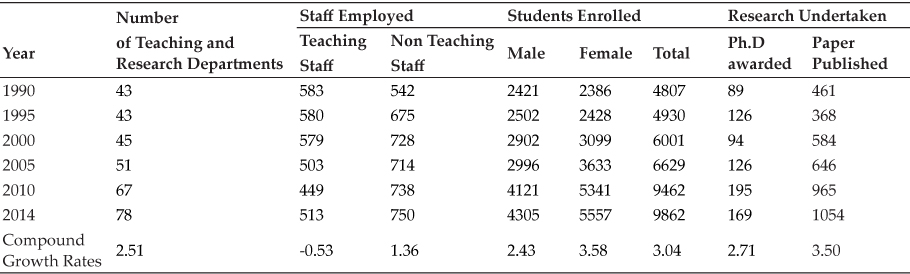
Source:Annual Reports of Panjab University (Various Issues).
Overall Techanical Efficiency (OTE), PTE and SE of departments of Panjab University
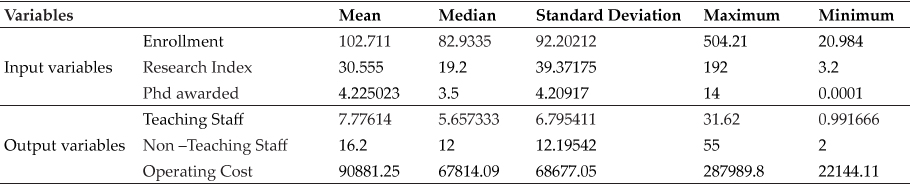
Table 2 Summaries the dataset for all inputs and outputs variables included in the present study.
Table 2, shows the maximum and minimum values for the data. It also describes the mean, median and s.d for different inputs and outputs variables.
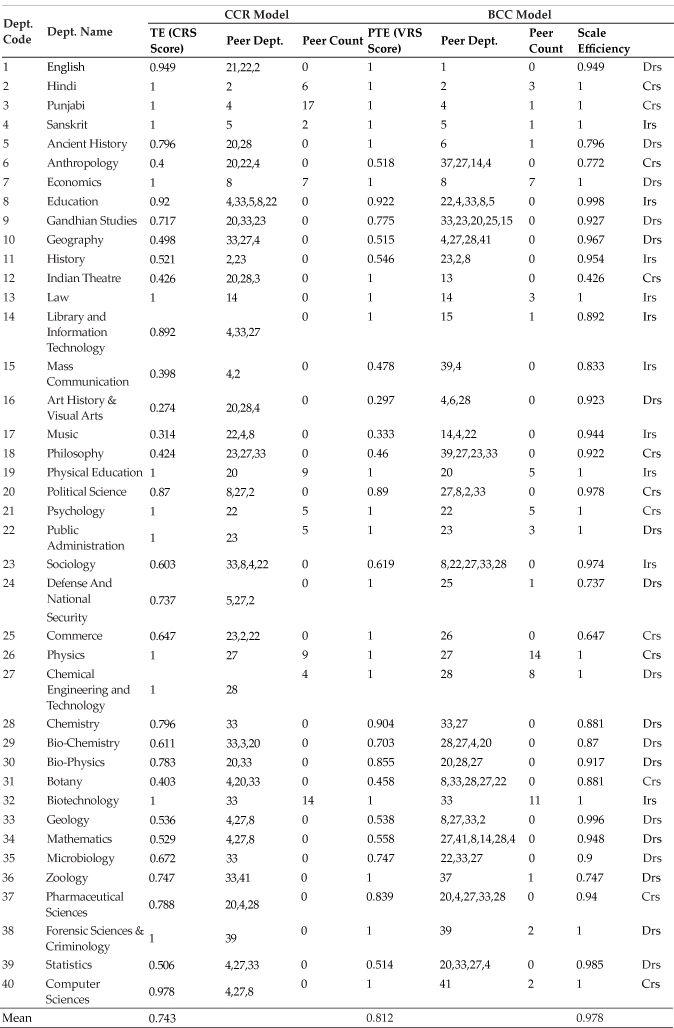
Table 3 shows the CRS and VRS efficiency scores of departments of the Panjab University, Chandigarh for the year 2014. According to CCR results, out of forty departments, only twelve departments were found to be efficient, of which three departments (Hindi, Punjabi and Sanskrit) were from Languages group, five (Economics, Physical Education, Psychology, Public Administration and Law) belonged to Social Sciences and four (Biotechnology, Physics, Chemical Engineering and Technology and Forensic Science and Criminology) were from Science group. All the remaining departments were comparatively technically less efficient as they had secured value less than One. The average efficiency score under CCR assumption was 0.743, indicating scope for improvement by 25.7 percent. The department of Punjabi appeared as peer for maximum number of departments (17), indicating that it was the most technically efficient department and its practises could be followed by other inefficient departments. It was interesting to note that the departments of Forensic Science and Law were efficient with score One, but did not appear in the reference set of any inefficient departments. The lowest efficiency score was registered for department of Art History and Visual Arts. It is to be noted that the departments which focused on Applied Arts i.e Indian Theatre, Mass Communication and Art History and Visual Arts were comparatively at the lower level of ladder where their efficiency scores are concerned. These departments were poor in performance, because they had low student enrollment, lack of research work, as well as these departments were not producing any PhDs.
The average PTE and SE scores were 0.812 and 0.978 respectively, implying that there was scope for improvement in managerial efficiency to the tune of 18 percent while that in the Scale Efficiency was to the tune of 2.2 percent. In other words, 18.8 percent point of 25.7 percent of average Overall Techanical Inefficiency (OTIE) was due to inappropriate management practices and remaining part of the OTIE was due to non-optimal scale. Out of forty departments, only twenty departments achieved the PTE efficiency score equal to One, of which eight (English, Ancient History, Indian Theatre, Library and Information Technology, Defense and National Security, Commerce, Zoology and Computer Sciences) departments were found to be ‘locally efficient’ and twelve (Hindi, Punjabi, Sanskrit, Economics, Law, Physical Education, Psychology, Public Administration, Physics, Chemical Engineering and technology,Biotechnology and Forensic Sciences) departments were ‘globally efficient’. It is further noted that in the remaining inefficient departments (PTE and SE both less than one), OTIE stemmed from both PITE and SIE. It was observed from the Table 2, that twelve (i.e 29 percent) efficient departments were operating at most productive scale CRS, while ten (i.e 24 percent) were below their optimal size and thus, experiencing Increasing Return to Scale (IRS) and remaining eighteen (i.e 44 percent) departments (like English, Ancient History, Economics, Gadhian Studies, Geography, History, Arts History, Public Administration, Defence and National Security studies, Chemical Engineering, Chemistry, Bio-chemistry, Bio-physics, Geology, Mathematics, Microbiology, Zoology, Statistics and Foreinsic Sciences) have been observed to be operating at Decreasing Return to Scale (DRS). The policy implication of this finding is that the majority of inefficient departments were operating at DRS and these departments can enhance OTE by optimising their scale of operation. The department of Biotechnology was appeared as a peer for maximum number of inefficient department’s (11) and the lowest efficiency score (0.297) was calculated for department of Art History, which could enhance its efficiency by improving its enrollment output by 237.14 percent and research output by 253.41 percent.
Table 2: Descriptive Statiatics for the department of Panjab University for the year 2014
Source: Author’s Calculations.
Table 3: Efficiency Scores Based on Overall Performance Model of Panjab University Chandigarh in 2014
Source: Authors Calculations.
SECTION IV: SENSITIVITY ANALYSIS
In order to check, which variable influenced most, the efficiency of the departments the senestivity analysis was applied. The objective of sensitivity analysis is to check the changes in the results when we eliminate a variable. “it is done to identify the strength of departments with regard to the missing performance dimensions. If a department is not considered efficient in only one model, for example, this implies that the DMUs bases its efficiency primarily on the variable which is omitted by the present model. On the other hand, when a department attains an efficiency score in the five evaluations, this suggests that this department is operating satisfactorily in terms of all activities” (Martine, 2003).
As we observed for the Table 4, model II, model III, model IV, model V and model VI are based on omitting or addition of output variables.
MODEL-II
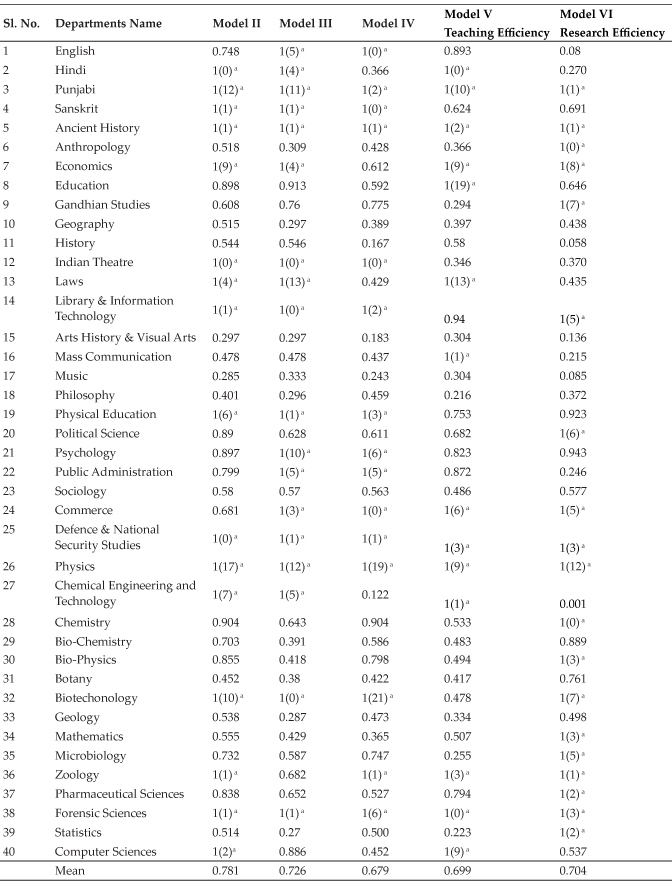
For this model three inputs and two outputs have been considered, the output variable ‘Phd awarded’ has been omitted. In year 2014, total fifteen departments were found to be efficient, and out of these fourteen departments belonged to peers group. The results indicated that the departments of English (25.2 percent reduction), Psychology (10.3 percent reduction) and Public Administration (20.1 percent reduction) have lost their efficiency and became less efficient, due to dropped out the Ph.D variable. Efficiency of some departments remained unchanged, which means that they are efficient in utilizing their resources to produce all the defined outputs as compared to their peers. As observed from the Table, the department of Physics became the most efficient department with maximum number of peer count ie 17.There is large difference in the efficiency scores between efficient and inefficient departments.
MODEL-III
In Model-III, Output variable ‘Research Index’ was dropped out. By doing this the aim of the study is to see the effect of this change on efficiencies and assess the ability of the department in the field concerning doctoral programs and enrollment. The analysis of the Table showed that the mean efficiency score has decreased significantly by 5.5 percentage points, indicating an increase in inefficiency of the departments. Thus it can be inferred that the research undertaken by the departments has a positive influence on the efficiency of the respective departments. The department of Zoology and computer Science became inefficient, when the Research output was dropped out, implying that these departments were sensitive to the dropout variable and they were not relatively efficient for doctoral programms. Other departments remained efficient, implying that these departments were not sensitive to the output variable Research index. The department of Laws appeared as the most efficient department with thirteen peer counts followed by department of Punjabi with eleven peer counts.
Table 4: Comparing Alternative Specification of the DEA Model
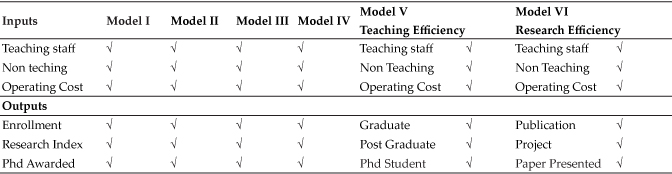
Table 5: Comparison of VRS Efficiency Scores of Performance Models in Year 2014
Source: Author’s Calculations.
MODEL IV
In Model IV, ‘enrollment’ variable was ommitted. Out of forty departments, only fifteen departments were performanced efficiently. All remaining departments were found to be inefficient. The consistant efficient departments are Physics, Punjabi and University Business School; they score one. The department of Biotechnology performed best and become peer (21) for maximum number of departments. While department of Laws, Hindi, Chemical Engineering and Computer Sciences, which were efficient in Model I became inefficient in model-IV, implying that these departments were efficient due to its enrollment output only. This result specifies that these departments should pay attention to make enhancement in ‘Research index’ and ‘number of students awarded Ph.D degree’ to become efficient. Many departments suffered a substantial drop as compare to model 1. The average PTE score was found to be 0.679. It is observed that all departments have scored lower than the efficiency score for model-I.
The results revealed that the department of Physics remains efficient throughout the study period, it indicates that the efficiency of Physics department did not affected by dropping of enrollment output, rather it was due to the efficient research work of department and Ph.D awarded. It is interesting to note that the efficiency score of the department of Indian Theatre, Mass Communication and Physical Education falls to Zero in the year 1990 , 1995 and 2000, indicating that the academic staff in these departments were not working as efficiently in the research work as their counterparts in the other departments.
Teaching Efficiency
For Model V, the average mean teaching efficiency score was 0.699, implying potential chances for improvement of 30.1 percent. Out of forty departments, only fourteen were found to be Teaching efficient, of which two departments (Hindi and Punjabi) were from Languages group, seven departments (Ancient History, Economics, Education, Law, Mass Communication, Commerce and Defense and National Security) belonged to Social Sciences group, five (Physics, Chemical Engineering, Zoology, Forensic Sciences and Computer Sciences) were from Sciences group. The least teaching efficiency score (0.216) was calculated for department of Philosophy, indicating that it could improve its efficiency by enhancing the enrollment in the Department.
It is clear from the above discussion, that the majority of Teaching efficient departments were from the Social Sciences group. Over the years, the teaching efficiency of Sciences departments has improved and that of the Languages departments decreased. All remaining departments are not performing well in term of teaching efficiency, due to shortage of academic and non-academic staff. Another reason for inefficiency is the departments are over burdened with students. The departments of sciences conduct remarkable research but lack in teaching efficiency. While the department of Anthropology, Gandhian Studies, History, Philosophy, Physical Education, Psychology, Chemistry, Biochemistry, Biophysics, Geology, Mathematics, Microbiology, Zoology and Statistics found to be teaching inefficient throughout the study period.
Research Efficiency
For model-VI we introduce research outputs as number of publications by faculty of each department, number of projects by each departments and number of paper presented by each departments and inputs remains the same. A look at the list of Research efficient department showed that one department (Punjabi) from Languages group, eight departments (Ancient History, Gandhian Studies, Anthropology, Economics, Political Science, Library and Information Technology , Commerce and Defense and National Security Studies) belonged to Social Sciences group and ten departments (Physics, Chemistry, Biophysics, Biotechnology, Mathematics, Microbiology, Zoology, Pharmaceutical Sciences and Forensic Sciences, Statistics) were from Sciences group. The results indicate that though the majority of research efficient departments were from Sciences group, the least efficiency score (0.001) was also calculated for the department of Chemical Engineering, followed by the department of English with 0.08 score, indicating that these departments could enhance their research efficiency by increasing number of publication and projects in the departments. The department of Physics appeared as the best performer in research activity with maximum number of peer count (12).
There are six departments that did not obtained efficiency score of One in any of the models. Three are from Arts and three from sciences. The department of Punjabi, Ancient History, Economics, Commerce, Defense and National Security, Physics, Zoology and Forensic Sciences were found to be both teaching and research efficient.
SECTION V: TOBIT REGRESSION ANALYSIS
To investigate the effect of concerned variables on technical efficiency of University’s departments, we employed Tobit regression model. Following factors based on various studies [(Kounetas et al. 2011), (Al-Bagoury, 2013), (Bangi, 2014), (Ismail, 2015), (Selim et al. 2015), (Goksen, 2015) & (Sonmez, 2015)] have been taken.
♦Tuition Fee - is the fee charged for instruction, as at a college or in the university. It is inclusive and covers all the charges made by the university for registration, tuition and examination. In our study, Tuition fee refers to the fee for the courses run by a particular department, which can graduate courses, post-graduate courses or doctoral programms.
♦Ratio of Professors to total teaching staff-There are three types of the academic staff in university departments- Professors, Associate Professors (Reader) and Assistant Professor, with Professors being at top of the academic ladder and Assistant Professors at the bottom.
♦Proportion of female students to total students enrolled- it shows the number of female students against total students enrolled in the academic department of the university.
♦Student-teacher ratio- this variable shows the number of student load per academic staff.
As the efficiencies of departments derived from DEA procedure takes value between 0 and 1, so we opted, the Tobit regression for examining the determinants of efficiency. The efficiency scores were taken as dependent variable. Therefore, the variable with (+) sign indicated positive relation and vice versa. The Tobit regression model for the efficiency terms is narrated as;
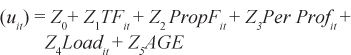
Table 6 shows that the Student-teacher ratio was found to be positively significant and has positive effect on efficiency of departments, indicating that if student-teacher ratio increased by one unit then the efficiency of department would be improved by .0349 units. The marginal effect of Ratio of professors to academic staff was found to be negatively significant. It state that if Ratio of professor to academic staff increased by one unit than the efficiency of departments would be decreases by 0.096 units, Because professor concentrate more on research activities and performs academic duties also and pay less time to teaching activities. The marginal effect of age of department was also found to be negative, indicating that the inefficiency increases as age of department increases; result in non-significant learning by doing effects.
Table 6: Tobit Regression
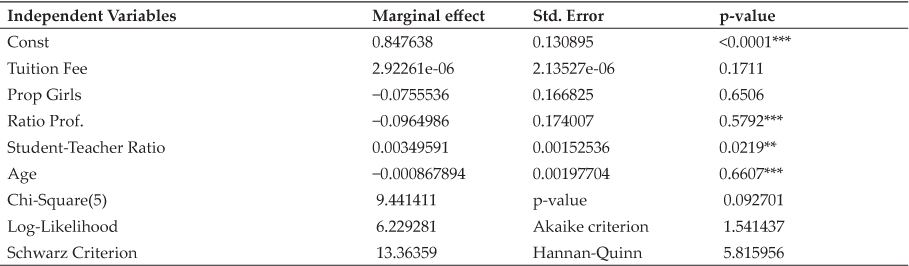
Notes: ***, ** and * indicates 1%, 5% and 10% significance levels respectively.
CONCLUSION
This paper has evaluated the performance of teaching departments of Panjab University, Chandigarh through DEA models using different combinations of input and output variables. The principle objective of the study is to analyze the activity-wise performance of the departments. This means that we want to evaluate which department is good for which specific activity like teaching or research. For this purpose, different assessments like overall performance, teaching performance and research performance were made by using 6 models.
Among all models, the highest mean (0.743) in technical efficiency are reported in Model-I. Therefore, overall performance is satisfactory for all departments. The lowest mean (0.679) are calculated for Model-III, in which ‘enrollment’ output dropped, this confirms that improvement is needed in the field of research.
For overall performance assessment, twelve departments, namely Hindi, Punjabi, Sanskrit, Economics, Law, Physical Education, Psychology, Public Administration, Physics, Chemical Engineering and Technology, Biotechnology and Forensic Sciences are good example to follow by inefficient departments to monitor and improve their performance.
The results of senstivity analysis in model II, III and IV, highlight the fact that the efficiency scores of departments decreased when one of the output dropped out.
Among teaching performance, the majority of teaching efficient departments were from the Social Sciences group and over the years, the teaching efficiency of Sciences departments improved and that of the Languages departments decreased. It is further observed that the majority of research efficient departments were from Sciences group, indicating that these departments are good performers for research activities like publications, research projects and paper presented.
The major factors influencing OTE, was Student-teacher ratio and Ratio of professors to total teaching staff. The variable student-teacher ratio enhanced the efficiency of academic departments, while factor RP negatively influence the efficiency of departments.
Thus our study provides information about every activity of departments and policy makers can use suggested improvements in different areas. There are some concluding remarks for the departments. Overall performance is good for all science departments. Other departments need improvements in their activity. Only department of Punjabi, Ancient History, Economics, Commerce, Defence and National Security Studies, Physics, Zoology and Forensic Sciences were found to be both teaching and research efficient. It was observed that every department should focus more on number of Ph.D. dgrees awarded and research performance to improve their performance.
REFERENCES
Abbott, M. and Daucouliagos, C. 2003. The efficiency of Australian universities: A data envelopment analysis. Economics of Education Review, 22: 89-97.
Agha, S.R., Kuhair, I., Abdul Nabi N. Salem, M. and Ghanim, A. 2011. Assessment of academic departments efficiency using data enevelopment analysis,journal of industrial engineering and Management, 4(2): 301-325.
Ahn, T. 1987. Efficiency and related issues in higher education: a data envelopment analysis approach. PhD thesis, the University of Texas at Austine.
Avkiran, N. 2002. Productivity Analysis in the Service Sector. Australia: N. K. Avkiran Publisher.
Avkiran, N.K. 2001. Investigating technical and scale efficiencies of Australian universities through data envelopment analysis. Socio-Economic Planning Sciences, 35(1): 57–80.
Aziz, N.A., Janor, R.M. and Mahadi, R. 2013. Comparative Department Efficiency Analysis within a University: A DEA Approach, Procedia-Social Behavioural Sciences, 90: 540-548.
Bagoury, A.S. 2013. DEA to evaluate efficiency of African higher education, Wyno Academic Journal of Education Research and Essays, 1(4): 39-46.
Bangi, Y.I. 2014. Efficiency assessment of Tanzanian private universities: Data Envelopment Analysis (DEA), International Journal of Education and Research, 2(5): 455-470.
Charnes, A., Cooper, W.W. and Rhodes, E. 1978. Measuring efficiency of decision-making units.
Cooper, W. and Seiford, L. 2001. K. Tone (2000); Data Envelopment Analysis: A Comprehensive Text with Models. Applications, References and DEA-Solver Software: Kluwer Academic Publishing, Boston et al. European Journal of Operational Research, 2: 429–444.
Halkas, G.E., Tzeremes, N.G. and Kourtzidis, S.A. 2010. A DEA approach for measuring university department’s efficiency. (MPRA), Munich Personal RcPEc Archive, No.24029, pp.1-26
Johnes, G. and Johnes, J. 1993. Measuring the research performance of UK economics departments: An application of data envelopment analysis. Oxford Economic Papers, 45.
Joreskog, K.G. 2002. Censored variable and censored regression, Goldberger (1964, p. 253) in analog with Probit model.
Kao, C. and Hung, H.T. 2008. Efficiency analysis of University departments: An empirical study. Omega, 36(4): 653-664.
Kounetas, K. et al. 2011. Departmental efficiency differences within a Greek university: An application of a DEA and Tobit analysis, International Transactions in Operational Research, 18: 545-559.
Martine, E. 2003. An application of the Data envelopment analysis methodology in the performance assessment of the Zaragoza University departments, Documetos de trabajo, 6(1).
Moreno, A. and Tadepalli, R. 2002. Assessing Academic Department Efficiency a Public University. Managerial and Decision Economics, 23(7): 385-397.
Ramanathan, R. 2003. An introduction to data envelopment analysis: A tool for performance measurement, New Delhi, Sage Publication.
Selim, S. and Bursalioglu, S.A. 2013. Analysis of the determinants of Universities efficiency in Turkey: Application of the data envelopment analysis and panel Tobit model, Procedia-Social and Behavioral Sciences, 89: 895-900.
Simar, L. and Wilson, P.W. 1998. Sensitivity analysis of efficiency scores: How to bootstrap in nonparametric frontier models, Management Science, 44(1): 49-60.
Sharma, M. and Mehra, A. and Meenakshi Sharma 2017. “Dynamics of Higher Education in Punjab”, International Journal of Management ‘ANVESHAK’, 6(1): 76-91.
Sharma, M. and Mehra, A. 2019. “Growth of Higher Education in India- Opportunities and Challenges”, International Journal of Scientific Research and Review, 7(3).
Sharma, M. and Mehra, A. 2019. “Working of State Universities in Punjab: An Exploratory Report”, The Journal of Institute of Public Enterprises, 12(1&2).
Tomkins, C. and Green, R. 1988. An experiment in the use of data envelopment analysis for evaluating the efficiency of UK university departments of accounting. Financial Accountability & Management, 4(2): 147–164.
Tyagi, P., Yadav, S.P. and Singh, S.P. 2009. Relative performance of academic departments using DEA with sensitivity analysis, Evaluation and Program Planning, 32: 168-177.